|
Marine Biodiversity and Ecosystem Functioning EU Network of Excellence |
|
|
|

Photo GalleryLoading video...
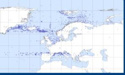
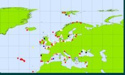
Engraulis encrasicolus
Description Gridded abundance map of European anchovy (Engraulis encrasicoluss). This product was developed with DIVA (Data-Interpolating Variational Analysis). Data was provided by ICES (IBTS dataset). The map shows how this species became more abundant the last decades in the North Sea. Scale: log-transformed CPUE.Citation: European Marine Observation Data Network (EMODnet) Biology project (www.emodnet-biology.eu), funded by the European Commission’s Directorate - General for Maritime Affairs and Fisheries (DG MARE). The mapped images, raster files and used parameters can be downloaded here. ·
This work is licensed under a Creative Commons Attribution-NonCommercial-ShareAlike 4.0 International License
Click here to return to the thumbnails overview Disclaimer: MarBEF does not exercise any editorial control over the information you may find at our species gallery. However, if you come across any misidentifications, spelling mistakes or low quality pictures, your comments would be very much appreciated. We will correct the information or remove the image from the website when necessary or in case of doubt © Copyright Notice To download: Acknowledge photographer (and copyright if different) when using these pictures in publications or web sites. VLIZ does not have copyright for these pictures, unless for those where it is explicitly stated. Click here for complete Copyright Notice. To upload: By uploading a picture you declare you have the right to do so. Please give as much information on the picture as possible; minimum requirement is photographer and/or copyright holder. Click here for complete Copyright Notice. |
| ||||||||||||||||||||||||||||||||||||||||||||||
 | Web site hosted and maintained by Flanders Marine Institute (VLIZ) - Contact data-at-marbef.org |